Python Pandas is a powerful library for data manipulation and analysis, providing essential tools to work with structured data seamlessly. This python pandas tutorial guide will walk you through the key concepts and techniques you need to master Pandas, starting with installation and setup, diving into DataFrames and Series, and exploring data visualization, time series analysis, and more.
What is Pandas?
Pandas is a widely-used, open-source library in Python that provides data manipulation and analysis tools, primarily for data science. It offers data structures like Series and DataFrames for handling and processing structured data efficiently. Pandas simplifies many complex data operations, making it an indispensable tool for data scientists, analysts, and engineers.
How does Pandas fit into the data science toolkit?
Pandas is a crucial part of the data science toolkit, as it enables data cleaning, transformation, and analysis within Python. It integrates seamlessly with other Python libraries like NumPy, SciPy, and scikit-learn, which are also essential for data science tasks. Moreover, Pandas is compatible with visualization libraries such as Matplotlib and Seaborn, making it a go-to library for end-to-end data analysis and visualization.
Alternatives to Pandas
While Pandas is a popular choice for data manipulation and analysis in Python, there are alternative libraries for data science available. Some of these alternatives include:
- Dask: A library for parallel computing that provides a scalable version of Pandas DataFrames, enabling processing of larger-than-memory datasets.
- Vaex: A high-performance library that allows for efficient, out-of-core data manipulation and visualization, particularly suited for large datasets.
- Modin: A library that aims to speed up Pandas by parallelizing operations and distributing data across multiple cores or even clusters.
- datatable: A library inspired by R’s data.table that focuses on performance and memory efficiency, especially for large datasets.
To start your journey with Pandas, check out our python pandas tutorial on Getting Started with Python Pandas: Installation and Setup.
Key Benefits of the Python Pandas Package
Pandas is a powerful and versatile library for data manipulation and analysis in Python. Here are some of the key benefits of using Pandas in your data science workflow:
- Flexible Data Structures: Pandas provides two main data structures: Series for one-dimensional data and DataFrames for two-dimensional data. These data structures allow for efficient handling, manipulation, and analysis of structured data.
- Handling Missing Data: Pandas has built-in support for handling missing data, making it easy to clean, preprocess, and analyze datasets with missing values. Functions like dropna(), fillna(), and interpolate() simplify dealing with missing data in your DataFrame.
- Efficient Data Manipulation: Pandas provides a wide range of methods and functions for data manipulation, such as sorting, filtering, merging, and reshaping data. This makes it easy to transform and preprocess your data before performing analysis or modeling.
- Grouping and Aggregation: With the powerful groupby() function, Pandas allows you to group data based on column values and perform aggregation operations, making it easy to derive insights from large datasets.
- Time Series Analysis: Pandas provides extensive support for working with time series data, including datetime objects, time offsets, resampling, and window functions. This makes it a go-to library for time series analysis in Python.
- Data Visualization: Pandas has built-in data visualization capabilities, based on the popular Matplotlib library, allowing you to create various types of plots directly from DataFrames and Series. This makes it easy to visualize patterns, trends, and outliers in your data.
- Compatibility with Other Libraries: Pandas is compatible with other popular data science libraries in Python, such as NumPy, Matplotlib, and Scikit-learn. This makes it easy to integrate Pandas into your data science workflow and leverage the strengths of multiple libraries.
- Strong Community and Support: Pandas has a large and active community of users and contributors who continually improve and expand the library. This means that you can find extensive documentation, tutorials, and support for Pandas online, making it easier to learn and use the library effectively.
Data Types in Pandas
In order to work effectively with Pandas, it’s important to understand the different data types that the library supports. Pandas uses several data types from the NumPy library as well as its own custom data types. Here’s a list of common Pandas data types:
- int: Integer values (e.g., int8, int16, int32, int64)
- float: Floating-point numbers (e.g., float16, float32, float64)
- bool: Boolean values (True or False)
- datetime64: Date and time values
- timedelta64: Time duration values
- category: Categorical values (a limited set of distinct categories)
- object: Arbitrary Python objects, typically strings
Understanding these data types is essential for effectively manipulating and analyzing data in Pandas.
DataFrames and Series
DataFrames and Series are the two main data structures provided by Pandas for working with structured data. A DataFrame is a two-dimensional tabular data structure with labeled axes (rows and columns), while a Series is a one-dimensional labeled array capable of holding any data type.
What is a DataFrame?
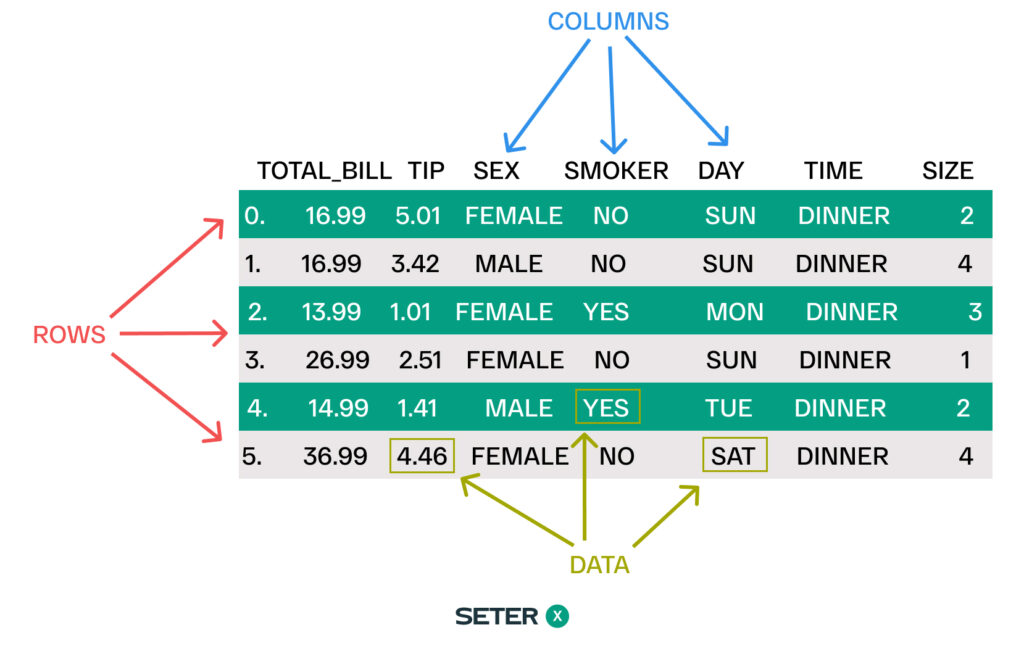
A DataFrame is a versatile data structure in Pandas that represents a two-dimensional table with labeled axes (rows and columns). Each column can contain data of different types, such as integers, floats, or strings. DataFrames provide a powerful and flexible way to work with structured data, allowing you to perform various operations like data cleaning, transformation, and analysis.
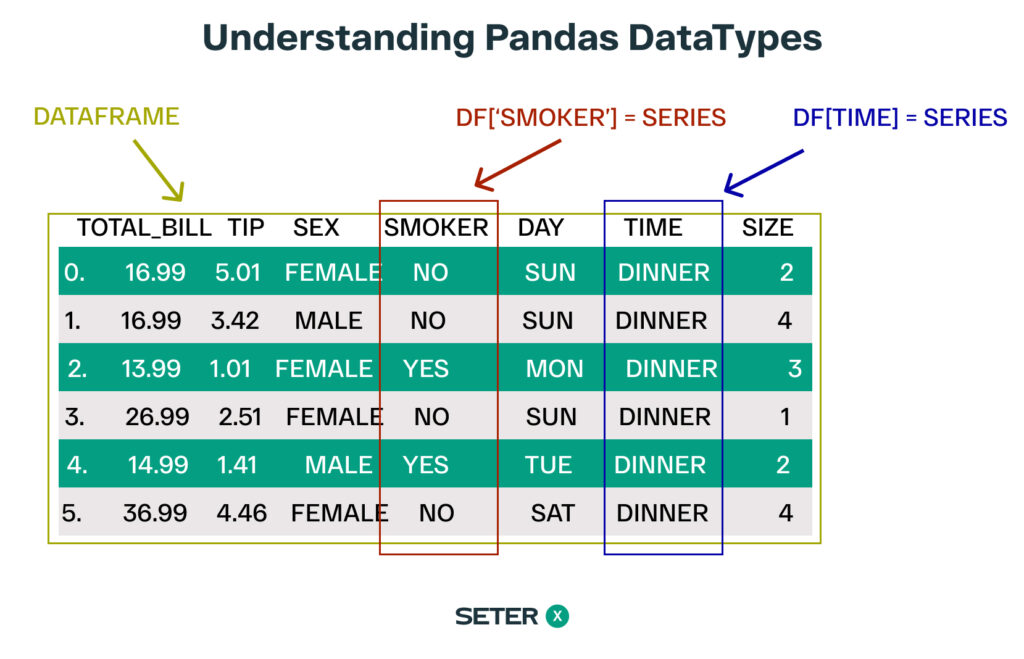
What is a Series?
A Series is a one-dimensional data structure in Pandas that can hold data of any type, such as integers, floats, or strings. It is similar to a list or an array in Python, but with the added benefit of being able to have custom labels for its elements, called an index. A Series can be thought of as a single column of data in a DataFrame.
Pandas DataFrame and Series
DataFrames and Series are the two main data structures provided by Pandas for working with structured data. A Pandas DataFrame is a two-dimensional tabular data structure with labeled axes (rows and columns), while a Series is a one-dimensional labeled array capable of holding any data type.
Here’s a quick overview of how to create DataFrames and Series:
import pandas as pd

# Create a DataFrame from a dictionary
data = {'col1': [1, 2, 3, 4],
        'col2': ['A', 'B', 'C', 'D']}
df = pd.DataFrame(data)

# Create a Series from a list
s = pd.Series([1, 2, 3, 4])
For a more in-depth look at DataFrames and Series, check out our guide on Working with DataFrames and Series in Pandas.
Data Import and Export
Pandas provides various functions to read and write data from and to multiple file formats such as CSV, Excel, JSON, and SQL databases. This makes it easy to import and export data for further processing or visualization.
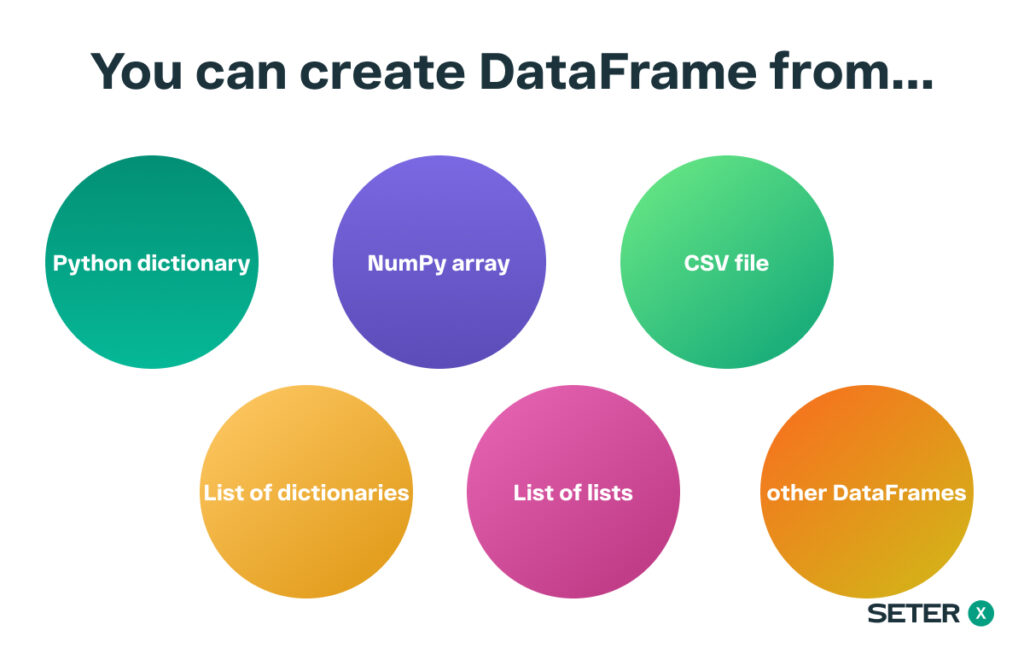
Here’s a quick overview of how to read and write data using Pandas:
import pandas as pd

# Read data from a CSV file
df = pd.read_csv('data.csv')

# Write data to a CSV file
df.to_csv('output.csv', index=False)

# Read data from an Excel file
df = pd.read_excel('data.xlsx', sheet_name='Sheet1')

# Write data to an Excel file
df.to_excel('output.xlsx', sheet_name='Sheet1', index=False)

# Read data from a JSON file
df = pd.read_json('data.json')

# Write data to a JSON file
df.to_json('output.json', orient='records')
For more details on data import and export in Pandas, see our guide on Reading and Writing Data with Pandas.
Data Cleaning and Transformation: Approach to missing data
Data cleaning and transformation are essential steps in the data analysis process. Pandas provides a wide range of tools to handle missing data, filter and sort data, and apply functions or transformations to columns or rows.
Here are some common data cleaning and transformation tasks in Pandas Dataframe:
import pandas as pd

# Drop missing values
df.dropna()

# Fill missing values with a specified value or method
df.fillna(0)

# Filter data based on conditions
filtered_df = df[df['column_name'] > value]

# Sort data by column values
sorted_df = df.sort_values(by='column_name', ascending=False)

# Apply a function to a column
df['new_column'] = df['column_name'].apply(lambda x: x * 2)
To learn more about data cleaning and transformation with Pandas, explore our guide on Cleaning and Transforming Data with Pandas.
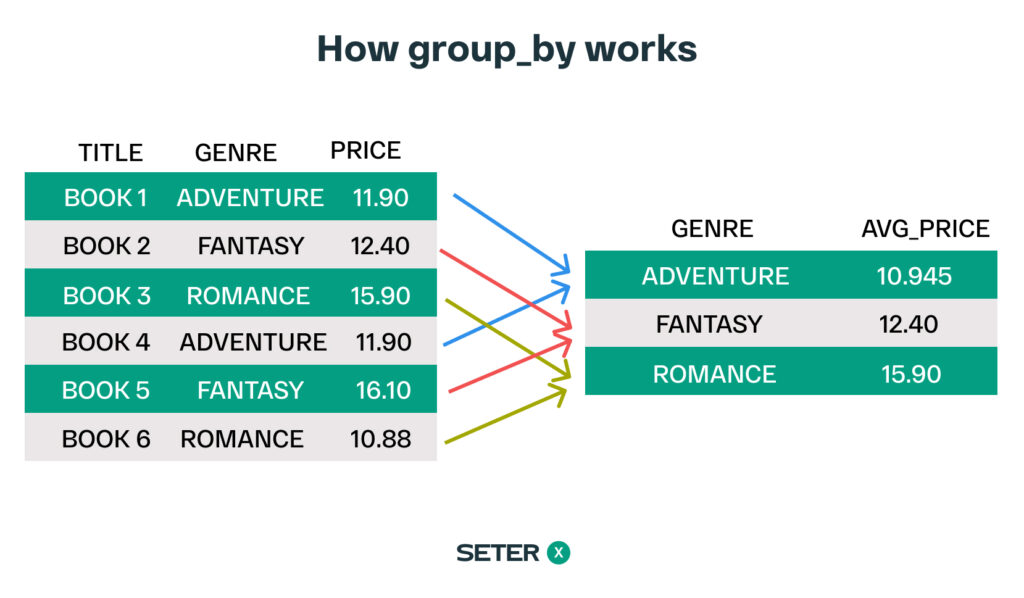
Data Aggregation and Grouping
Pandas offers powerful aggregation and grouping functions that allow you to summarize and analyze your data effectively. You can use built-in aggregation functions like sum, mean, min, and max, or apply custom aggregation functions using the agg method.
Here’s a quick overview of how to aggregate and group data in Pandas Dataframe:
import pandas as pd

# Calculate the mean value of a column
mean_value = df['column_name'].mean()

# Group data by one or more columns
grouped_df = df.groupby('grouping_column')

# Aggregate data using built-in or custom functions
aggregated_df = grouped_df.agg({'column_name': ['sum', 'mean']})
For more information on data aggregation and grouping, check out our python pandas tutorial on Data Aggregation and Grouping in Pandas.
Data Visualization
Pandas integrates seamlessly with visualization libraries like Matplotlib and Seaborn, making it easy to create plots and charts for data analysis. You can generate various types of visualizations, such as bar plots, scatter plots, line plots, and more.
Here’s an example of creating a bar plot using Pandas and Matplotlib:
import pandas as pd
import matplotlib.pyplot as plt

# Create a simple DataFrame
data = {'Category': ['A', 'B', 'C', 'D'],
        'Value': [10, 15, 8, 12]}
df = pd.DataFrame(data)

# Create a bar plot
ax = df.plot.bar(x='Category', y='Value', rot=0)
plt.show()
To learn more about data visualization with Pandas and other libraries, read our python pandas tutorial on Data Visualization with Pandas, Matplotlib, and Seaborn.
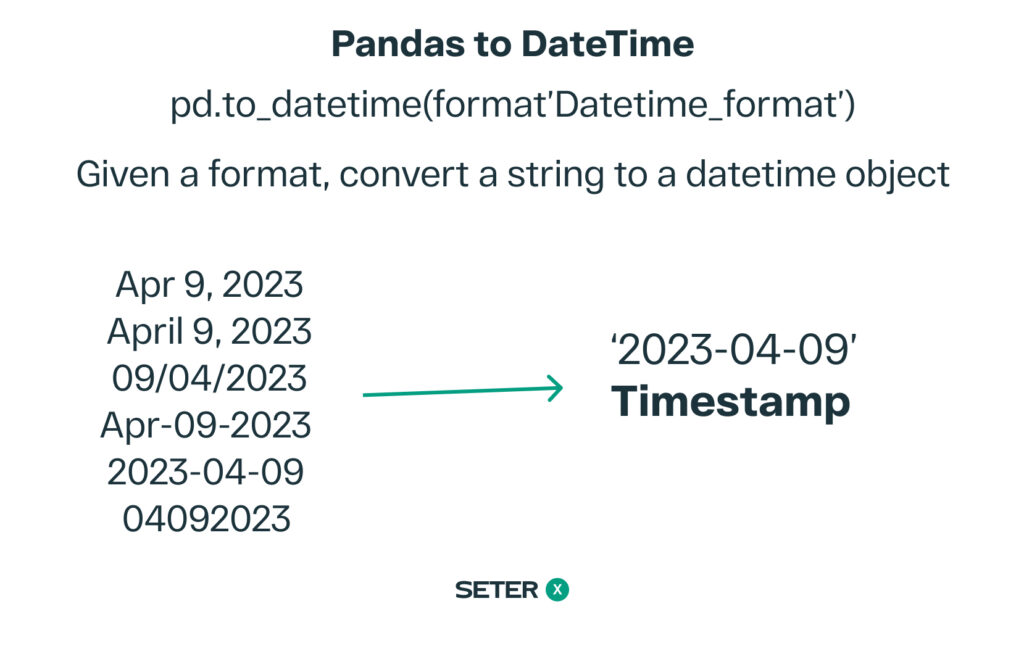
Time Series Analysis
Pandas provides extensive support for working with time series data, making it a popular choice for financial and time-dependent data analysis. With Pandas, you can easily manipulate and analyze time series data using built-in functions for resampling, rolling window calculations, and time zone handling.
Here’s a quick overview of how to work with time series data in Pandas:
import pandas as pd

# Convert a column to datetime
df['date_column'] = pd.to_datetime(df['date_column'])

# Set the DataFrame index to the datetime column
df.set_index('date_column', inplace=True)

# Resample time series data (e.g., daily to monthly)
monthly_data = df.resample('M').sum()

# Calculate a rolling window function (e.g., 7-day moving average)
rolling_mean = df['column_name'].rolling(window=7).mean()
For a more comprehensive guide on time series analysis with Pandas, see our tutorial on Time Series Analysis with Pandas.
Merging, Joining, and Concatenating DataFrames
In data analysis, you often need to combine multiple DataFrames to create a single, unified dataset. Pandas provides several methods for merging, joining, and concatenating DataFrames, allowing you to easily combine datasets based on common columns or indexes.
Merging DataFrames
The merge() function in Pandas allows you to merge DataFrames based on common column values. This operation is similar to SQL joins. You can specify various types of joins, such as inner, outer, left, and right, using the how parameter.
import pandas as pd

# Merge two DataFrames on a common column
merged_df = pd.merge(df1, df2, on='common_column', how='inner')
Joining DataFrames
The join() method in Pandas allows you to join DataFrames based on index values. This is particularly useful when you have DataFrames with different columns but shared index values.
# Join two DataFrames on their index
joined_df = df1.join(df2, how='inner')
Concatenating DataFrames
The concat() function in Pandas is used to concatenate DataFrames along a particular axis (rows or columns). This operation is useful when you have DataFrames with similar structures and want to combine them into a single DataFrame.
# Concatenate DataFrames vertically (along rows)
concatenated_df = pd.concat([df1, df2], axis=0)

# Concatenate DataFrames horizontally (along columns)
concatenated_df = pd.concat([df1, df2], axis=1)
By mastering these techniques, you can efficiently combine multiple Pandas DataFrames to create unified datasets for further analysis. For more information and examples on merging, joining, and concatenating DataFrames, refer to our tutorial on Merging, Joining, and Concatenating DataFrames in Pandas.
Advanced Topics
Pandas offers numerous advanced features and techniques that can further enhance your data analysis workflow. Some of these advanced topics include:
- Pivot tables and cross-tabulation
- Multi-level indexing and advanced indexing techniques
- Performance optimization with vectorization, Cython, and parallel processing
Top 5 Python Pandas Interview Questions
Here are some common interview questions related to Python Pandas that you may encounter:
- What are the differences between a Pandas Series and a DataFrame? A Series is a one-dimensional labeled array capable of holding any data type, while a DataFrame is a two-dimensional tabular data structure with labeled axes (rows and columns). DataFrames can be thought of as a collection of Series with a shared index.
- How do you handle missing data in Pandas? Pandas provides several methods for handling missing data, such as dropna() to remove missing values, fillna() to fill in missing values with a specified value or method (e.g., forward fill or backward fill), and interpolate() to fill missing values using interpolation techniques.
- How do you apply a custom function to each element or group of elements in a DataFrame? You can use the apply() function to apply a custom function to each element or group of elements in a DataFrame along a specified axis. Additionally, you can use applymap() to apply a function element-wise or map() for element-wise substitution in a Series.
- Explain the difference between loc[] and iloc[] in Pandas. In Pandas, loc[] is used for label-based indexing, allowing you to access rows and columns in a DataFrame based on index labels and column names. On the other hand, iloc[] is used for position-based (integer-based) indexing, allowing you to access rows and columns based on their index positions.
- What are the different types of joins available in Pandas? Pandas provides four types of joins: inner, outer, left, and right. These joins can be used with the merge() function for joining DataFrames based on common column values, or with the join() method for joining DataFrames based on index values.
For more Python Pandas interview questions and detailed explanations, refer to our article Top Python Pandas Interview Questions and Answers.
Conclusion
Pandas is an indispensable Python library for anyone dealing with structured data. Its capabilities extend to handling duplicate rows, working with continuous variables, and processing numerical values. With the ability to easily import and export data from various formats such as CSV files, Pandas simplifies the process of data manipulation in Python. The pd alias is commonly used to import Pandas, streamlining its integration into your codebase.
Pandas allows you to work with a wide range of real-world data, transforming it into Python objects like DataFrames and Series, which can be accessed and modified using intuitive square bracket notation. The library also provides a flexible indexing system, utilizing row labels and column labels to simplify data access and manipulation.
By mastering the powerful features and benefits of the Pandas library, you will be better equipped to handle complex data analysis tasks and derive valuable insights from your data.