
As an experienced software engineer, I’ve had my fair share of working with data using Python Pandas. In this article, we’ll explore the Pandas Series – a powerful, flexible data structure that is often overshadowed by its more popular sibling, the DataFrame. However, understanding Pandas Series is crucial for mastering data manipulation and analysis in Python.
If you’re new to Python Pandas, I recommend reading these articles to get started:
- Getting Started with Python Pandas: Installation and Setup
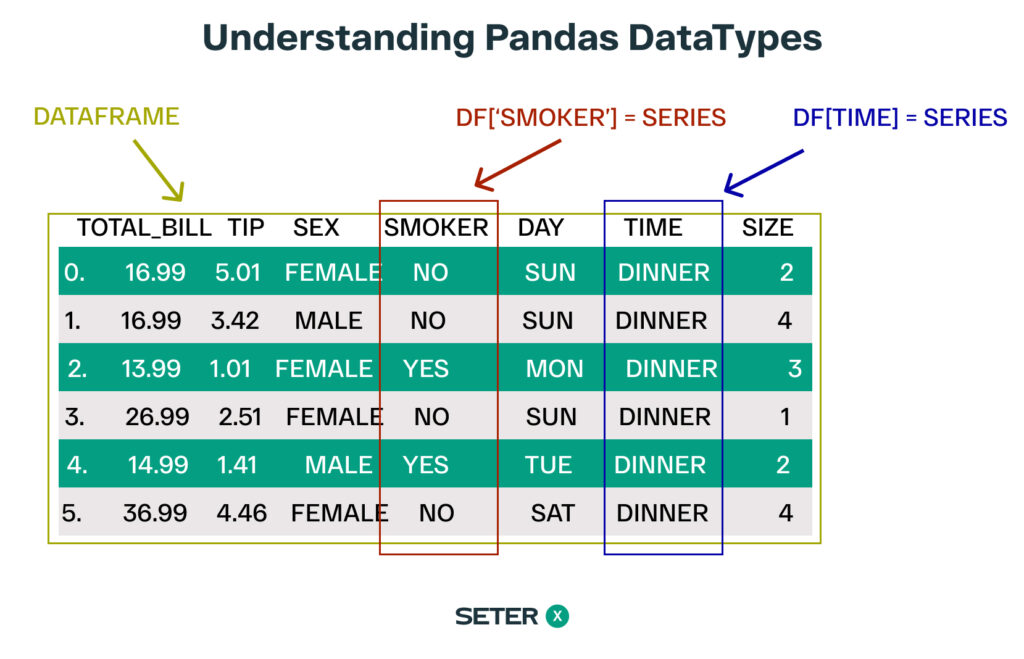
- Understanding Pandas DataFrames: A Deep Dive
What is a Pandas Series?
A Pandas Series is a one-dimensional labeled array capable of holding any data type. It is similar to a Python list or a NumPy array, but with the added benefit of labels that provide more context to your data.
Creating a Pandas Series
To create a Pandas Series, you can use the pd.Series() constructor, passing in a list, NumPy array, or dictionary as an argument. Let’s create a simple Pandas Series containing the monthly average temperatures (in Fahrenheit) for New York City.
import pandas as pd

average_monthly_temps = [32, 35, 42, 53, 63, 72, 77, 75, 68, 57, 48, 38]
months = ['Jan', 'Feb', 'Mar', 'Apr', 'May', 'Jun', 'Jul', 'Aug', 'Sep', 'Oct', 'Nov', 'Dec']

temps_series = pd.Series(average_monthly_temps, index=months)
print(temps_series)
The output would be:
Jan    32
Feb    35
Mar    42
Apr    53
May    63
Jun    72
Jul    77
Aug    75
Sep    68
Oct    57
Nov    48
Dec    38
dtype: int64
Accessing and Modifying Data in a Series
Accessing Data
You can access data in a Pandas Series using either the label-based index or the integer-based position.
- Label-based index:
print(temps_series['Jan'])Output:
32
- Integer-based position:
print(temps_series[0])Output:
32
Modifying Data
Modifying data in a Series is as simple as assigning a new value to an existing index.
temps_series['Jan'] = 33
print(temps_series['Jan'])
Output:
33
Common Operations on Pandas Series
Descriptive Statistics
Pandas Series provides several methods for calculating descriptive statistics, such as the mean, median, and standard deviation.
mean_temp = temps_series.mean()
median_temp = temps_series.median()
std_dev_temp = temps_series.std()

print(f"Mean: {mean_temp}, Median: {median_temp}, Standard Deviation: {std_dev_temp}")
Output:
Mean: 54.0, Median: 52.5, Standard Deviation: 16.30950643030009
Filtering Data
You can filter data in a Pandas Series using boolean conditions.
above_avg_temps = temps_series[temps_series > temps_series.mean()]
print(above_avg_temps)
Output:
May    63
Jun    72
Jul    77
Aug    75
Sep    68
Oct    57
dtype: int64
Arithmetic Operations
Pandas Series supports arithmetic operations like addition, subtraction, multiplication, and division. The operations are applied element-wise.
temps_series_celsius = (temps_series - 32) * (5/9)
print(temps_series_celsius)
Output:
Jan     0.000000
Feb     1.666667
Mar     5.555556
Apr    11.666667
May    17.222222
Jun    22.222222
Jul    25.000000
Aug    23.888889
Sep    20.000000
Oct    13.888889
Nov     8.888889
Dec     3.333333
dtype: float64
Applying Custom Functions
You can apply custom functions to a Pandas Series using the .apply() method. Let’s create a custom function to convert the temperatures from Celsius to Fahrenheit and apply it to our Celsius Series.
def celsius_to_fahrenheit(temp_celsius):
    return (temp_celsius * (9/5)) + 32

temps_series_fahrenheit = temps_series_celsius.apply(celsius_to_fahrenheit)
print(temps_series_fahrenheit)
Output:
Jan    32.0
Feb    35.0
Mar    42.0
Apr    53.0
May    63.0
Jun    72.0
Jul    77.0
Aug    75.0
Sep    68.0
Oct    57.0
Nov    48.0
Dec    38.0
dtype: float64
As you can see, the original Fahrenheit temperatures are recovered after applying the custom function to the Celsius Series. Learn more about applying custom functions in our article.
Frequently asked questions
Conclusion
Now you have a good understanding of Python Pandas Series, and you’re ready to harness its power in your data analysis journey. Make sure to check out the other articles in this series to dive deeper into Pandas capabilities:
- Mastering Data Selection and Filtering in Pandas
- Pandas Data Manipulation: Sorting, Renaming, and Merging DataFrames
- Grouping and Aggregating Data with Pandas: The Power of GroupBy
- Pandas Time Series Analysis: Working with Dates and Time
- Data Visualization with Pandas: Exploring Built-in Plotting Tools