Grouping and aggregating data are crucial operations in data analysis, as they help uncover patterns and trends within the data. In this tutorial, we will explore the powerful GroupBy functionality in Pandas, which enables you to perform complex grouping and aggregation operations with ease.
By the end of this tutorial, you’ll have a solid understanding of how to create GroupBy objects, perform basic operations, and leverage aggregation functions and custom aggregation.
Introduction to GroupBy
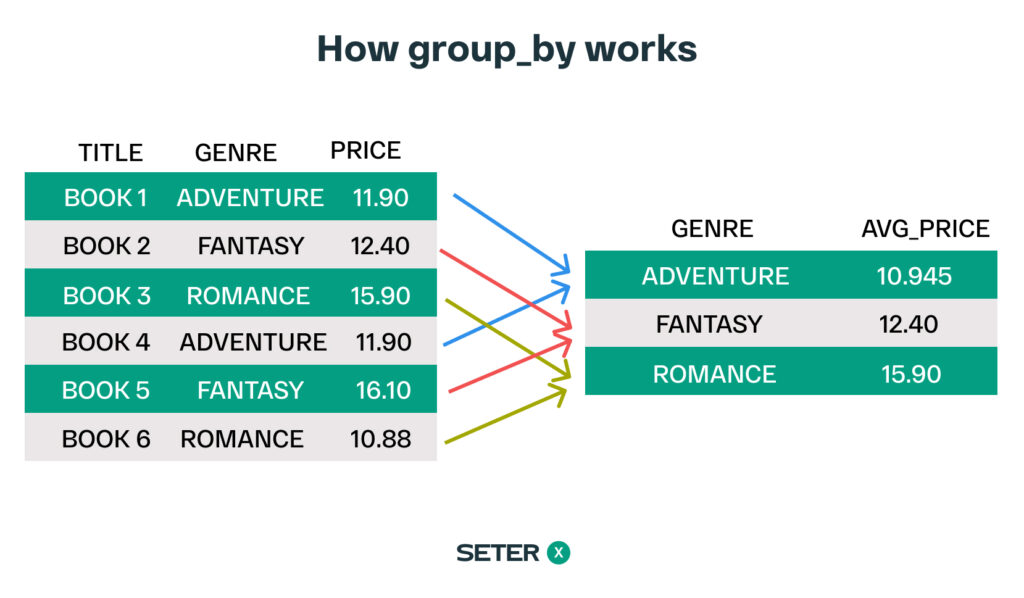
The GroupBy functionality in Pandas is inspired by the SQL GROUP BY clause, which groups data based on specific columns and then applies aggregation functions to the groups. Similarly, the Pandas groupby() method enables you to group data by one or more columns or even custom functions, and then apply various aggregation functions to the groups.
In the following sections, we will learn how to create and manipulate GroupBy objects and apply built-in and custom aggregation functions.
Creating GroupBy Objects
To create a GroupBy object, use the groupby() method on a DataFrame. You can pass one or more column names or custom functions as arguments to group the data.
Let’s create a sample DataFrame to demonstrate GroupBy functionality:
import pandas as pd

data = {
  'Category': ['A', 'B', 'A', 'B', 'A', 'B', 'A', 'A'],
  'Subcategory': ['X', 'X', 'Y', 'Y', 'X', 'Y', 'X', 'Y'],
  'Value': [10, 20, 30, 40, 50, 60, 70, 80]
}

df = pd.DataFrame(data)
print(df)
Now, let’s create a GroupBy object by grouping the data based on the ‘Category’ column:
grouped = df.groupby('Category')
print(grouped.groups)
{'A': [0, 2, 4, 6, 7], 'B': [1, 3, 5]}GroupBy Operations
Once you have created a GroupBy object, you can perform various operations on the groups. Some of the most common operations include aggregation, transformation, and filtering.
Here are a few examples of basic GroupBy operations:
- Aggregation: Compute summary statistics for each group, such as the mean, sum, or count.
mean_values = grouped['Value'].mean()
print(mean_values)
Category
A 48.0
B 40.0
Name: Value, dtype: float64- Transformation: Apply a function to each group independently.
normalized = grouped['Value'].transform(lambda x: (x - x.min()) / (x.max() - x.min()))
print(normalized)
0 0.000000
1 0.000000
2 0.285714
3 0.500000
4 0.571429
5 1.000000
6 0.857143
7 1.000000
Name: Value, dtype: float64- Filtering: Filter out groups based on a condition.
filtered = grouped.filter(lambda x: x['Value'].sum() > 100)
print(filtered)
Category Subcategory Value
0 A X 10
1 B X 20
2 A Y 30
3 B Y 40
4 A X 50
5 B Y 60
6 A X 70
7 A Y 80Aggregating Functions and Custom Aggregation
Aggregating functions are used to compute summary statistics for each group in a GroupBy object. Pandas provide a range of built-in aggregation functions, and you can also create custom aggregation functions.
Built-in Aggregating Functions
Some of the built-in aggregating functions available in Pandas are:
count(): Count the number of non-NA/null values in each groupsum(): Compute the sum of values in each groupmean(): Compute the mean of values in each groupmedian(): Compute the median of values in each groupmin(): Find the minimum value in each groupmax(): Find the maximum value in each groupstd(): Compute the standard deviation of values in each groupvar(): Compute the variance of values in each groupfirst(): Get the first non-NA/null value in each grouplast(): Get the last non-NA/null value in each group
You can apply these functions to a GroupBy object by calling the corresponding method. For example, to compute the sum of the ‘Value’ column for each group, you can do:
sum_values = grouped['Value'].sum()
print(sum_values)
Category
A 240
B 120
Name: Value, dtype: int64Custom Aggregation Functions
In addition to built-in Pandas allows you to create custom aggregation functions using Python functions or lambda functions. To apply a custom aggregation function, use the agg() or aggregate() method on a GroupBy object.
Here’s an example of applying a custom aggregation function to find the range (difference between the maximum and minimum values) of the ‘Value’ column for each group:
def value_range(series):
    return series.max() - series.min()

range_values = grouped['Value'].agg(value_range)
print(range_values)
Category
A 70
B 40
Name: Value, dtype: int64You can also use a lambda function to achieve the same result:
range_values = grouped['Value'].agg(lambda x: x.max() - x.min())
print(range_values)
Category
A 70
B 40
Name: Value, dtype: int64To apply multiple aggregation functions at once, pass a list of functions to the agg() method:
agg_values = grouped['Value'].agg([sum, 'mean', value_range])
print(agg_values)
sum mean value_range
Category
A 240 48.0 70
B 120 40.0 40This will return a DataFrame with the sum, mean, and range of the ‘Value’ column for each group.
Multi-level Grouping and Aggregation
Pandas allows you to perform multi-level grouping and aggregation by passing a list of column names or functions to the groupby() method. This can be useful when you want to analyze data at different levels of granularity.
Let’s demonstrate multi-level grouping and aggregation with our sample DataFrame:
multi_grouped = df.groupby(['Category', 'Subcategory'])
print(multi_grouped.groups)
{('A', 'X'): [0, 4, 6], ('A', 'Y'): [2, 7], ('B', 'X'): [1], ('B', 'Y'): [3, 5]}Now, let’s apply some aggregation functions to the multi-level GroupBy object:
multi_agg_values = multi_grouped['Value'].agg([sum, 'mean', value_range])
print(multi_agg_values)
sum mean value_range
Category Subcategory
A X 130 43.333333 60
Y 110 55.000000 50
B X 20 20.000000 0
Y 100 50.000000 20This will return a DataFrame with the sum, mean, and range of the ‘Value’ column for each combination of ‘Category’ and ‘Subcategory’.
To access the result for a specific combination, you can use the loc[] indexer:
result = multi_agg_values.loc[('A', 'X'), 'mean']
print(result)43.333333333333336Frequently asked questions
Conclusion
We covered the powerful GroupBy functionality in Pandas, which enables you to perform complex grouping and aggregation operations with ease. We explored how to create GroupBy objects, perform basic operations, apply built-in and custom aggregation functions, and work with multi-level grouping and aggregation.
With this newfound knowledge, you’re now better equipped to analyze and summarize your data effectively using Pandas. To further expand your Pandas expertise, consider exploring topics like Pandas data transformation, handling missing data in Pandas, and Pandas time series analysis.